Advanced Home Solar Monitoring Dashboard
Explore it here
The Sitch
We got solar panels on the roof and a battery pack at home. The provided dashboard, however, is not that good. The system does offer an api, though, so I made my own.
Objectives
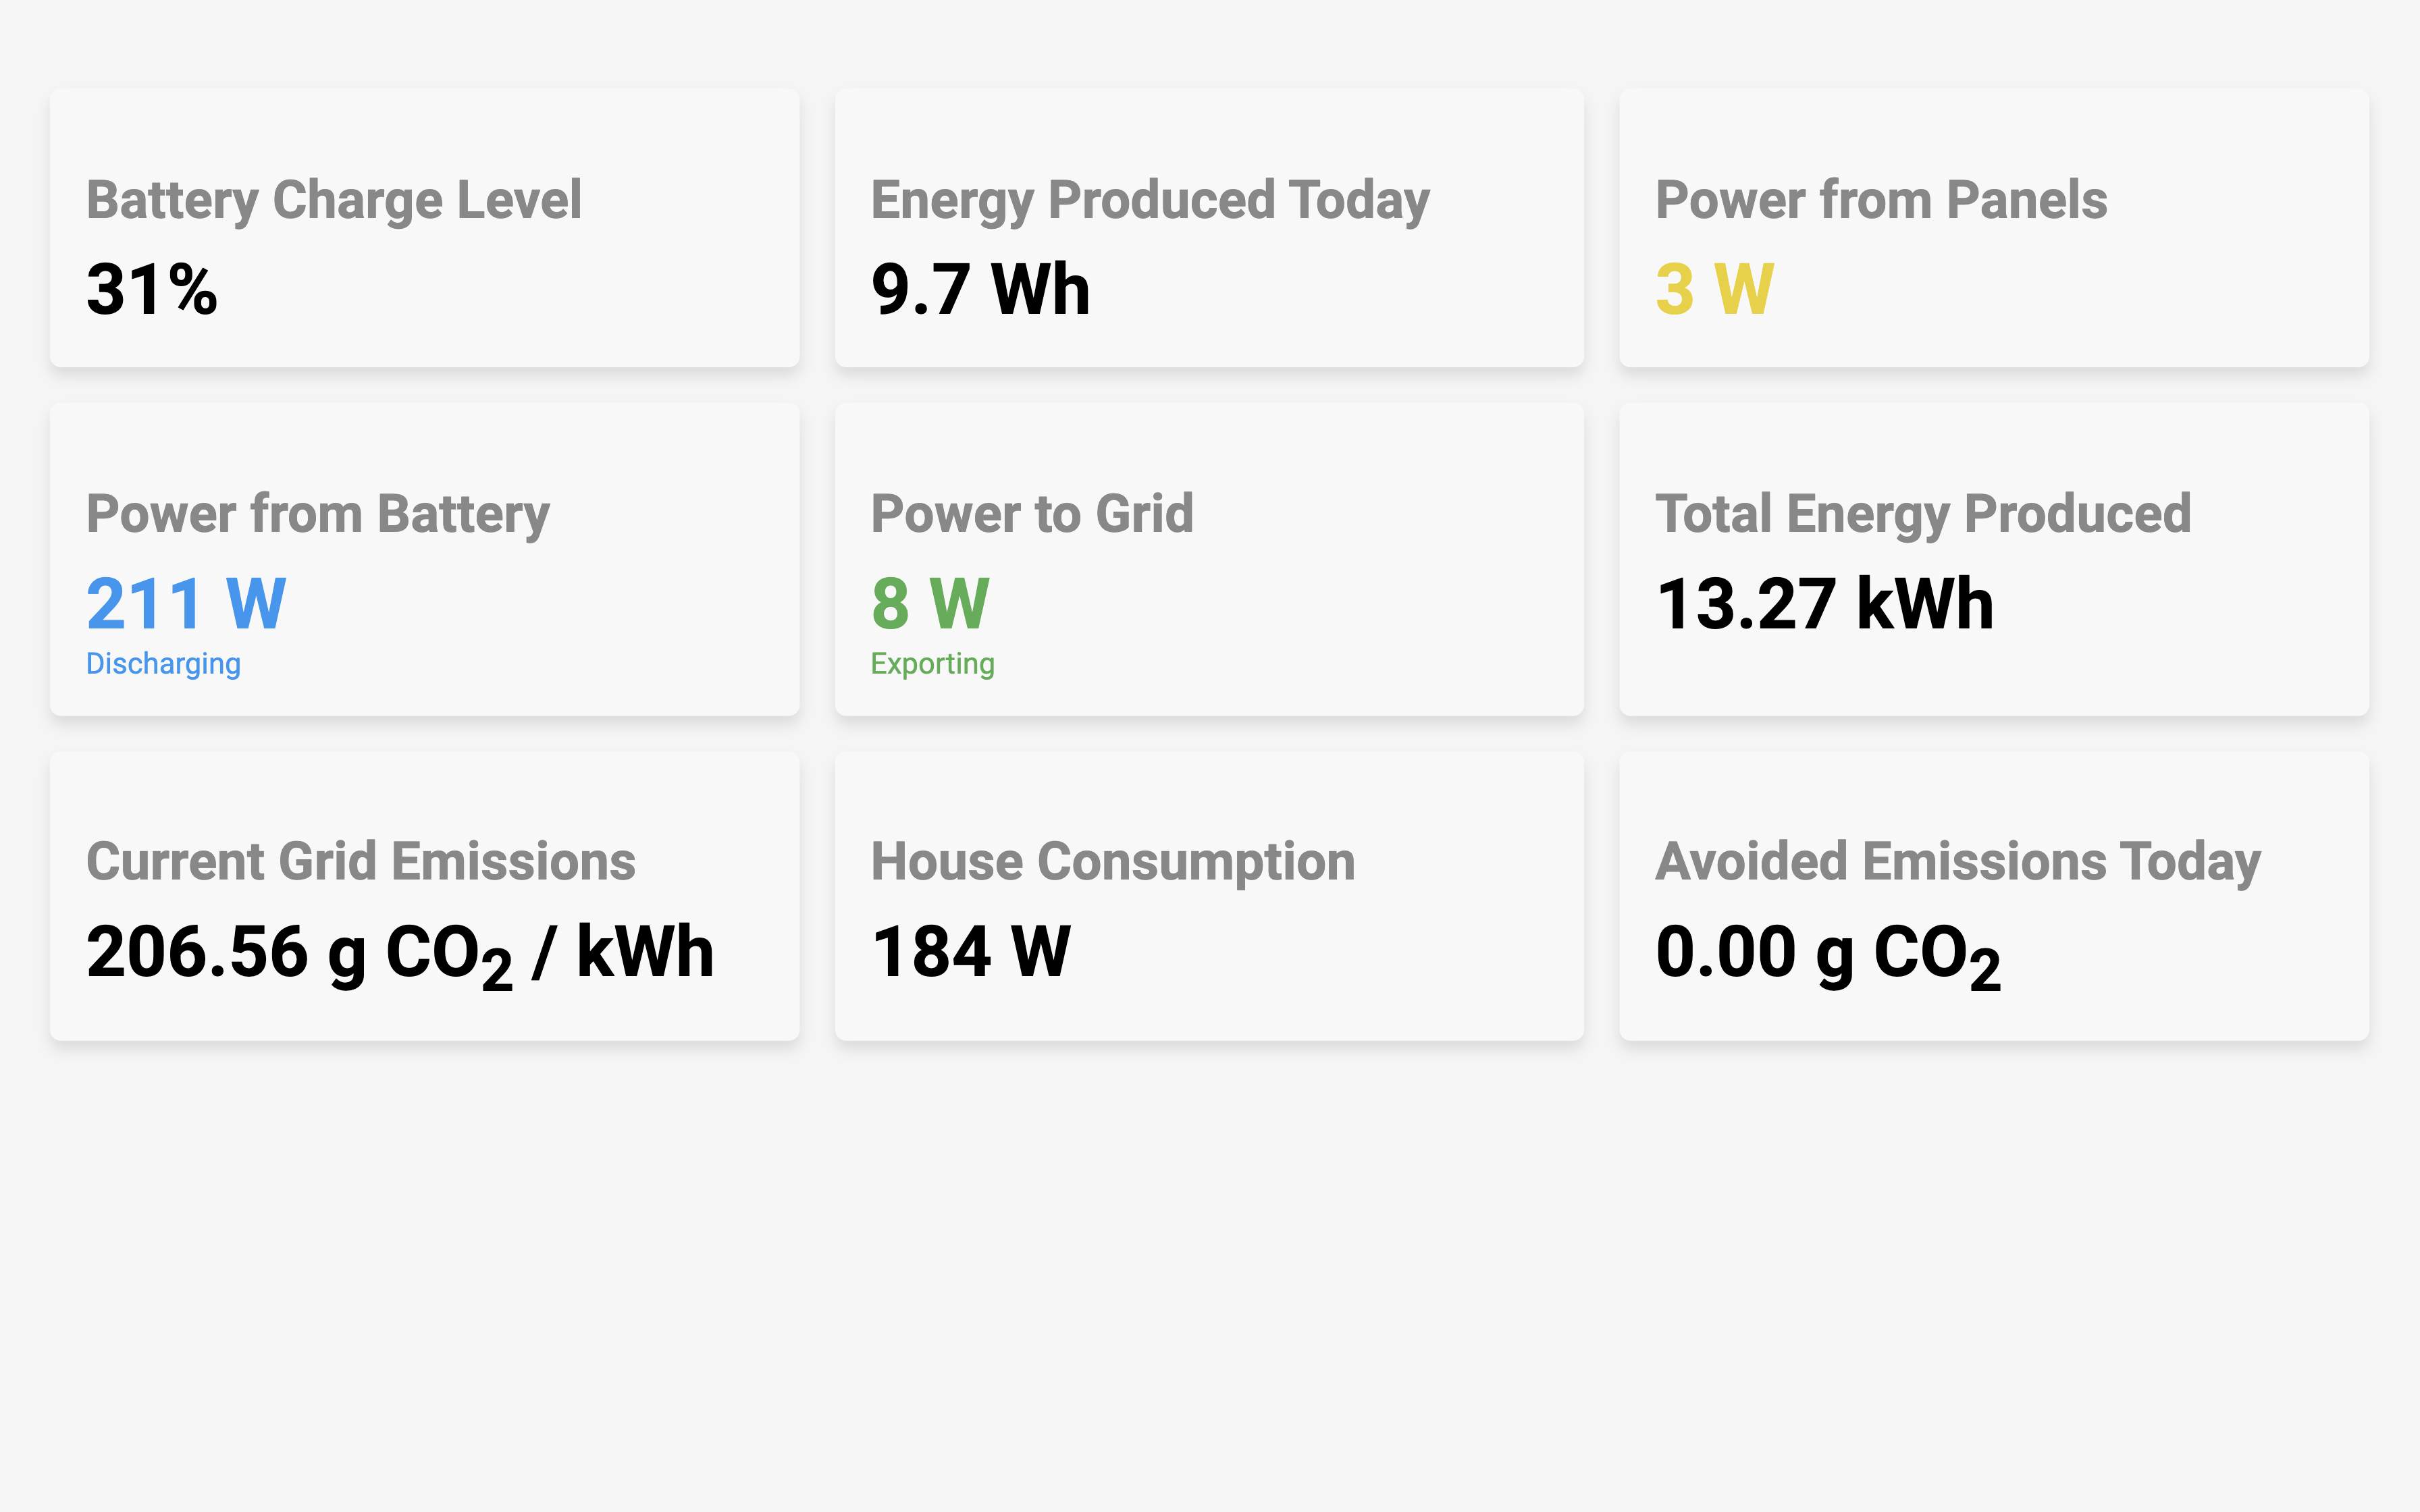
The primary objective is to offer a centralized platform that can:
- Display real-time updates of key energy metrics at a glance.
- Visualize environmental data like grid emissions and emissions avoided.
- Show all indicators in understandable units.
- Integrate a Return on Investment (ROI) graph.
- Include a graph showing the return on CO2 savings.
Technology Stack
Python, Flask, and Pandas
The server is a simple Flask app, so I can use Python libraries I'm familiar with.
Matplotlib for Data Visualization
Graphs are generated using Matplotlib with aggto work on the headless server, at a fixed file location linked in the webpage.
HTML/CSS
The frontend is crafted with HTML and CSS, organizing information into a responsive layout of "cards" that dynamically update to reflect real-time data.
System Architecture
-
Data Collection: Data from the solar inverters is continuously logged to a CSV file.
-
Scheduled Tasks: Using APScheduler, the system periodically generates and updates graphs based on the collected data.
-
User Interface: The frontend updates dynamically to show the latest metrics from the solar panels and battery using HTMX.